[New Feature] Track Request Queue Time With X-Request-Start
![[New Feature] Track Request Queue Time With X-Request-Start](https://www.datocms-assets.com/36416/1696848050-klemens-kopfle-s2jbq6qxvk-unsplash-1-copie.jpg?fit=crop&fm=jpg&h=514&w=960)
Scalingo is improving its integration with the main Application Performance Monitoring (APM) on the market by including the X-Request-Start header on all requests that pass through our router servers. Thanks to this, it's now easier than ever to track the time a request waits in the queue, before being processed by your application.
What is a Request Queue Time?
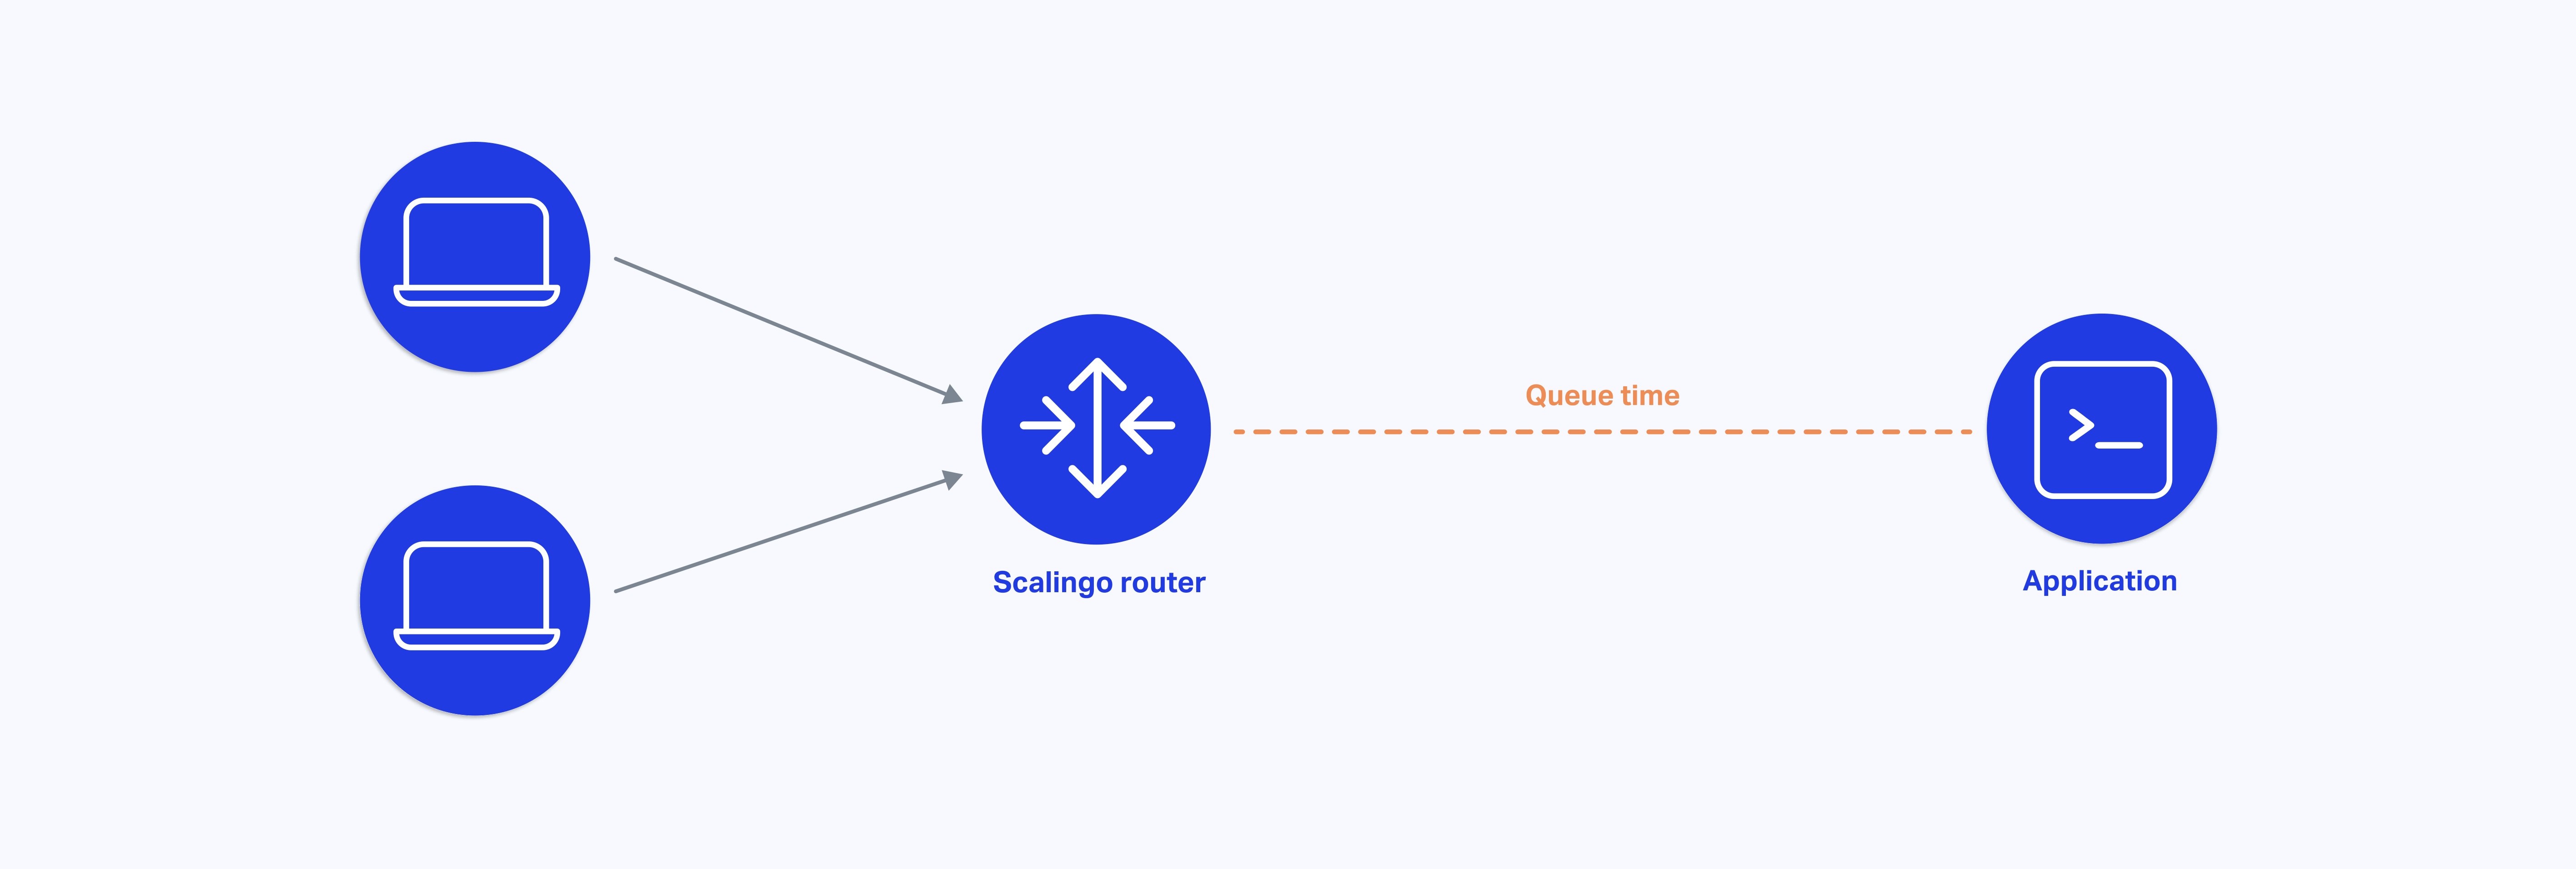
The request queue time is the time passed between Scalingo’s routers receiving a request and your application code processing the request. To put it another way it is the time a request waits before your application code starts processing it.
How Does the Request Queue Work?
When running a web service on a Platform-as-a-Service like Scalingo, HTTP requests addressed to a web service go through an HTTP router. Scalingo router is based on OpenResty which is an extremely powerful and dynamic reverse proxy, capable of processing thousands of requests per second.
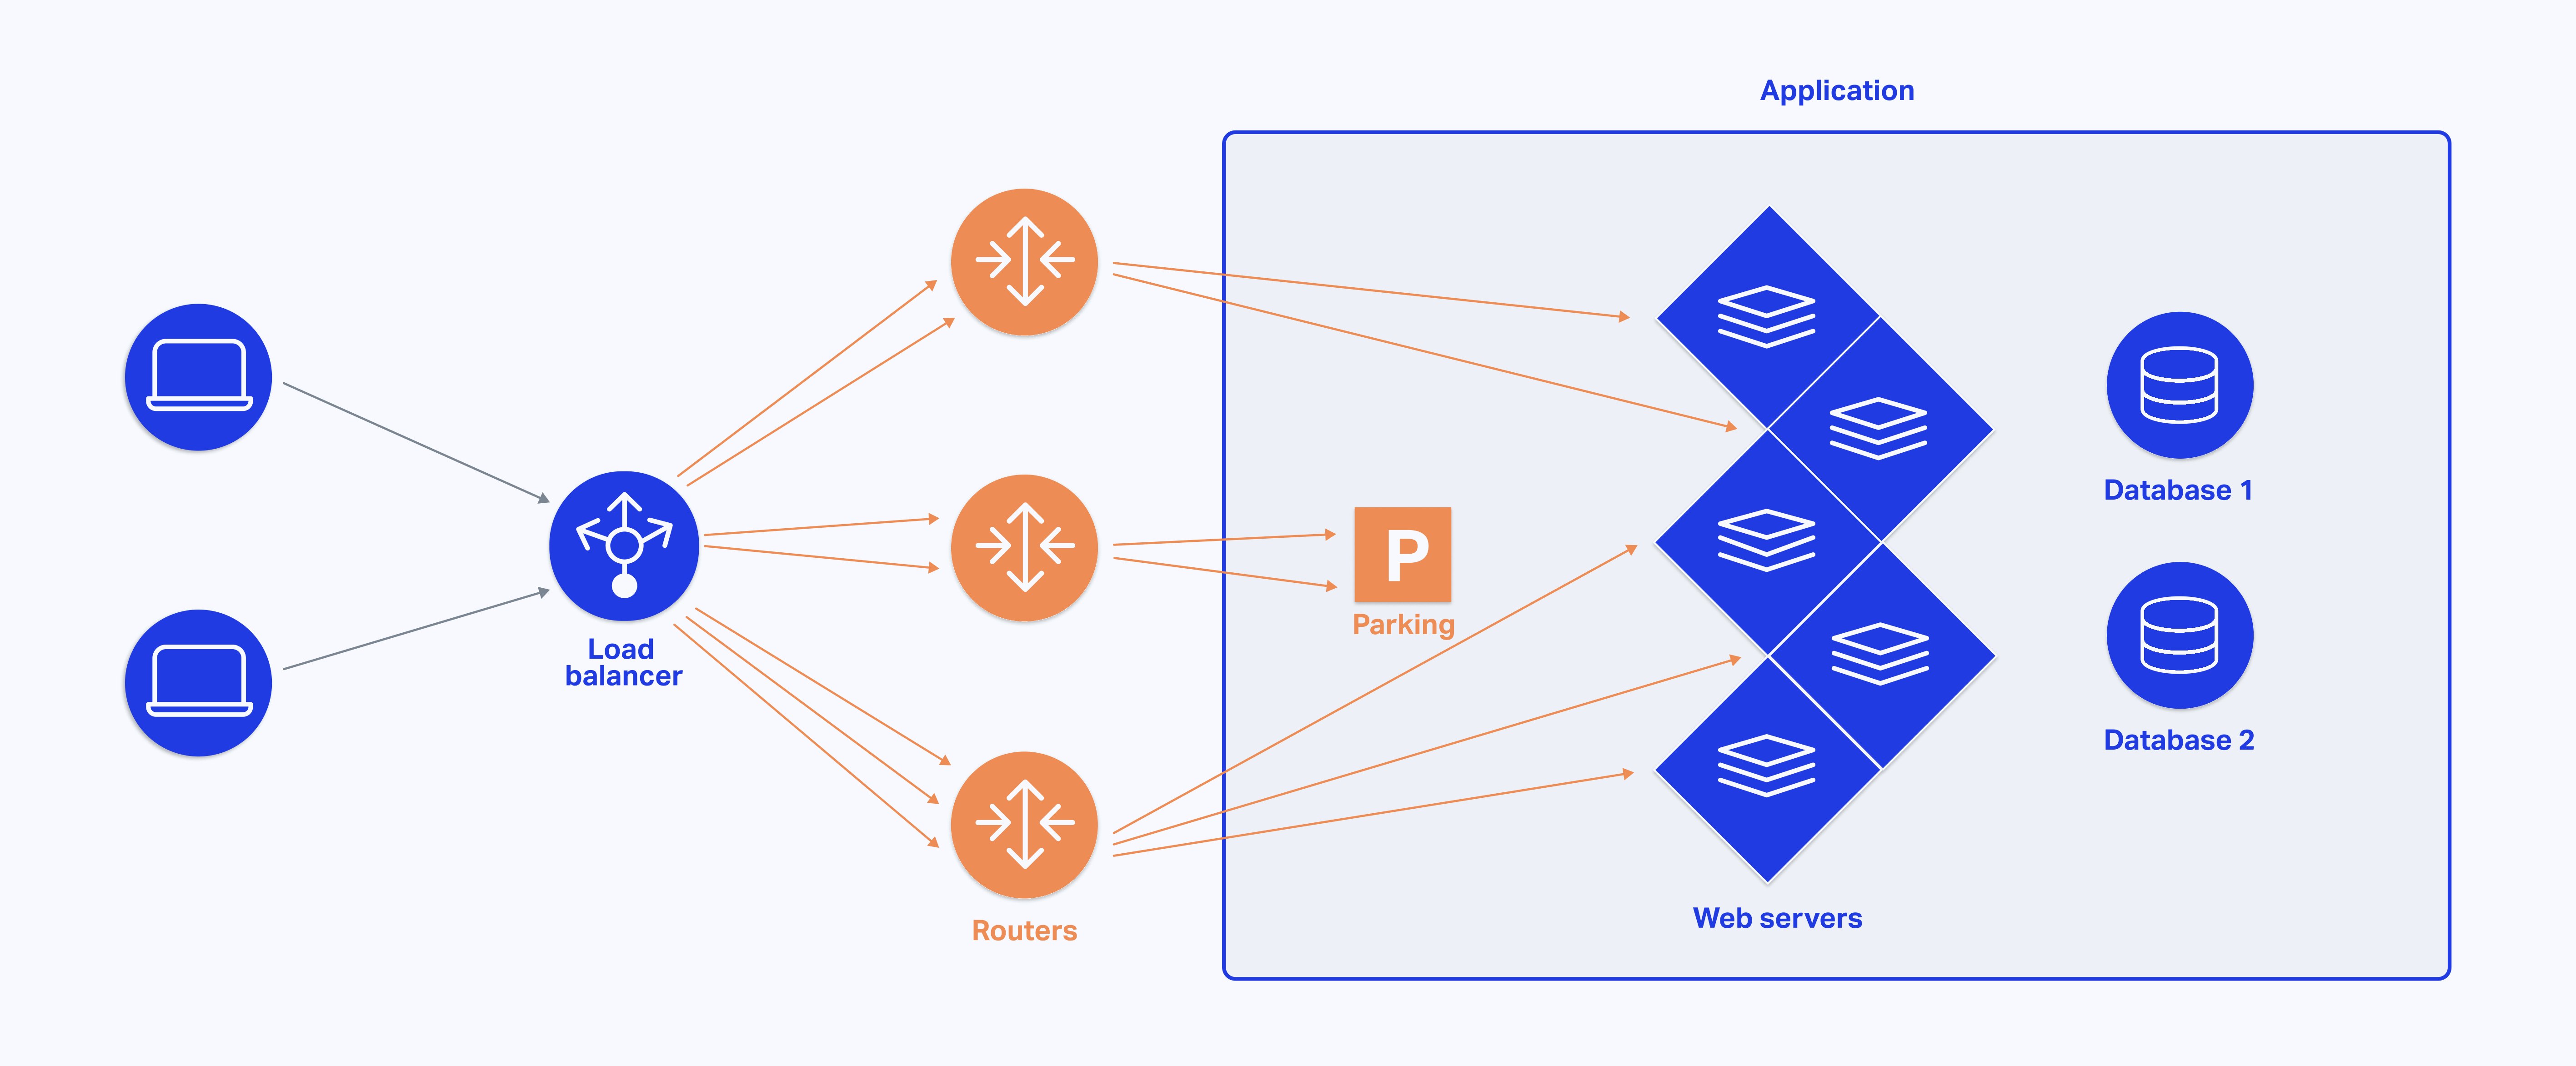
Each router on Scalingo infrastructure has a requests queue (which acts as a temporary parking area), stacking HTTP requests until the recipient web service is ready to handle them.
Why is X-Request-Start Useful?
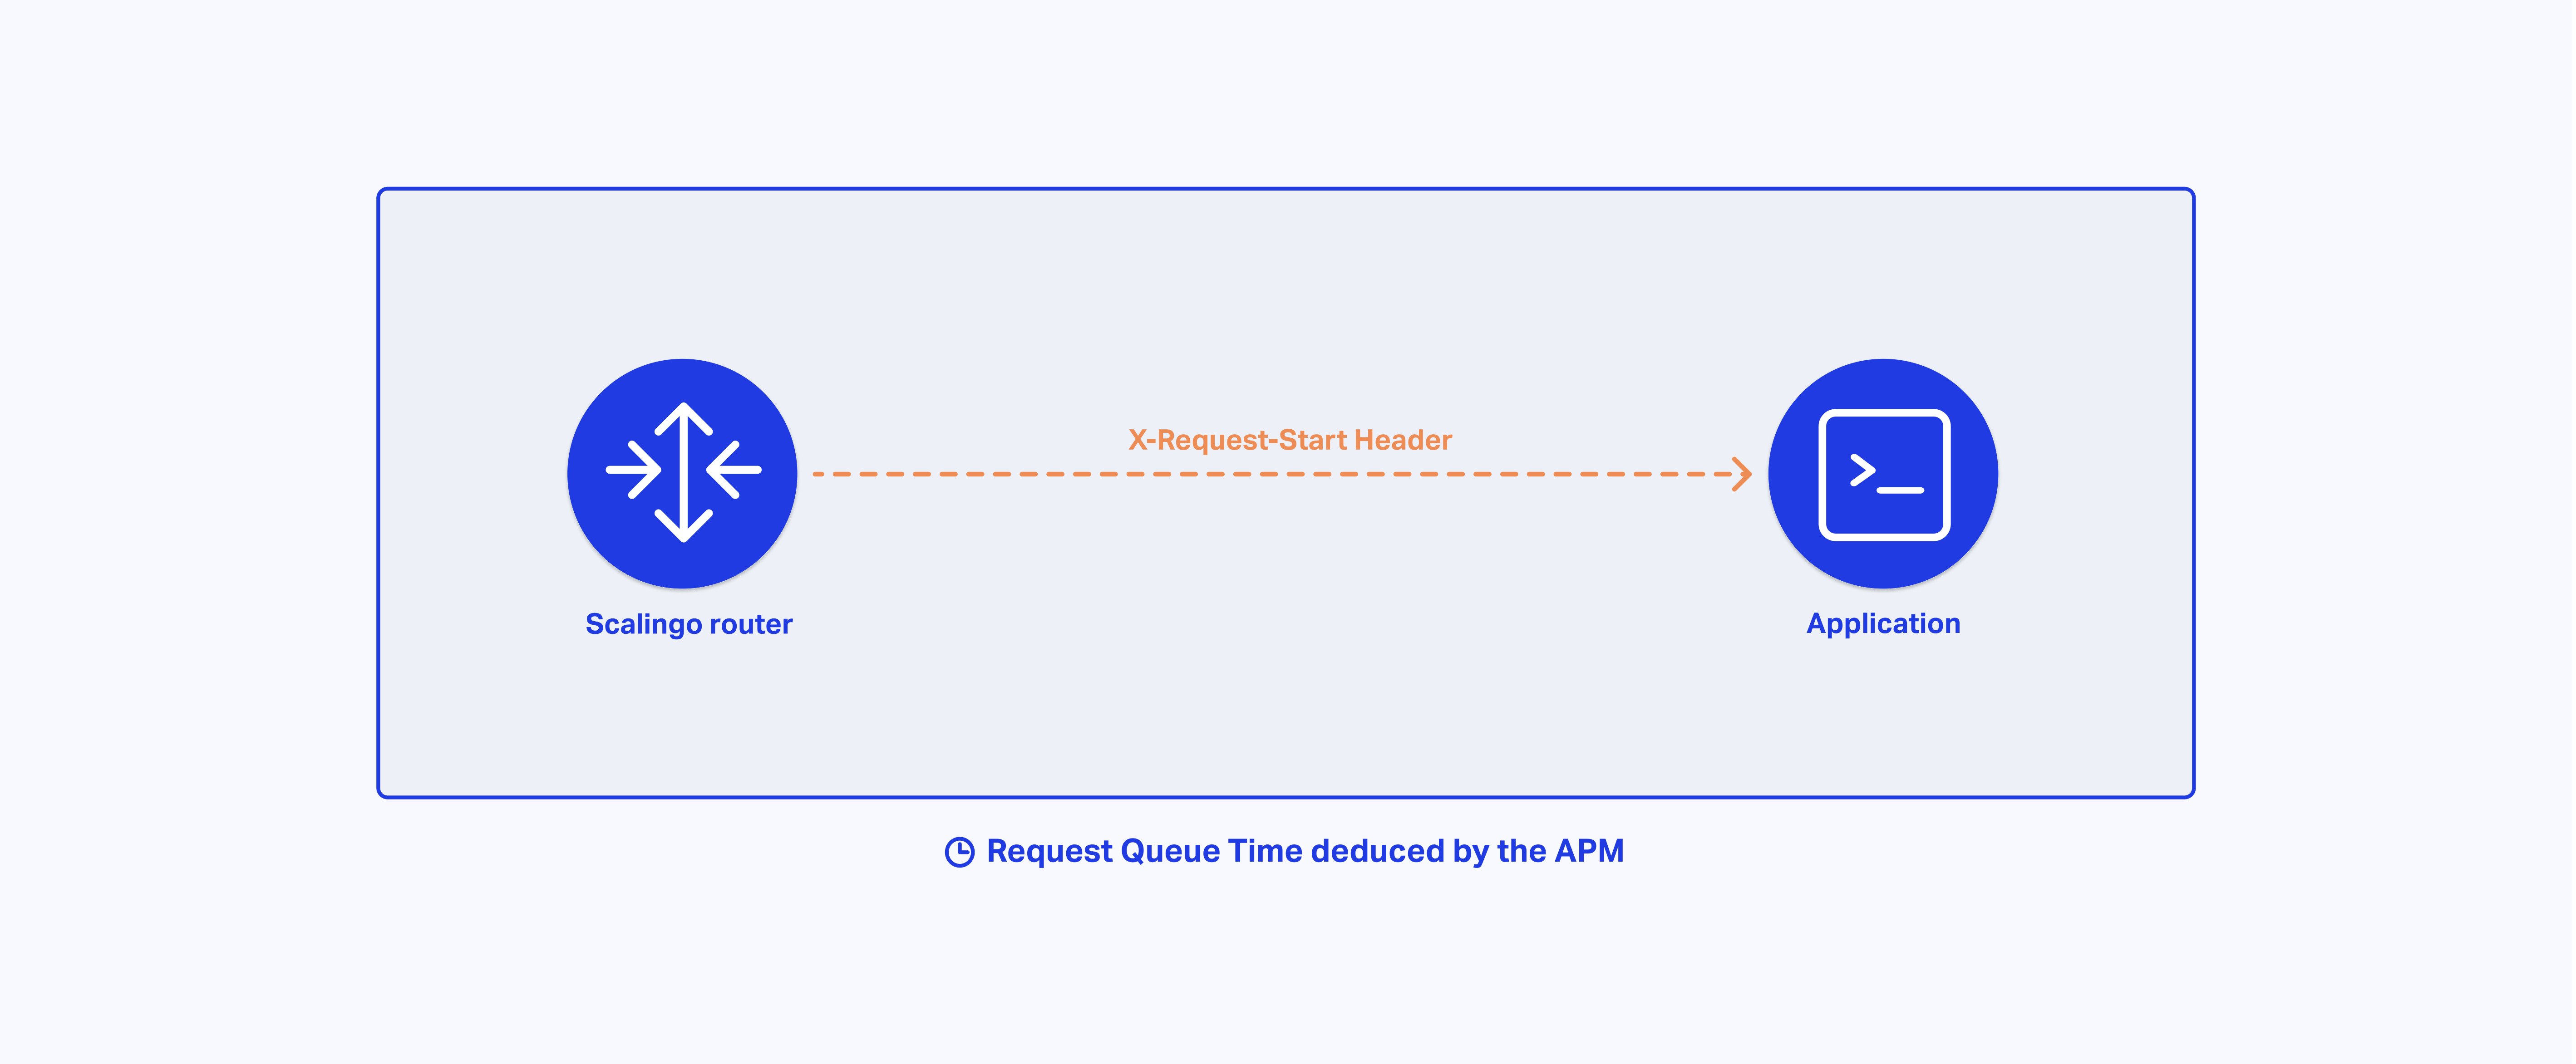
Monitoring the time spent by requests in the requests queue can be really helpful to better understand the performance of a web service. That's why we have enabled the X-Request-Start header globally. Starting today, every request that passes through our router servers will contain the UNIX timestamp of when the request was first received.
Once your application starts processing that specific request you, or your APM (Application Performance Management), you can compare the current time to the X-Request-Start time to deduce the "Request Queue Time" or “Request Queuing” (depending on the tool you use).
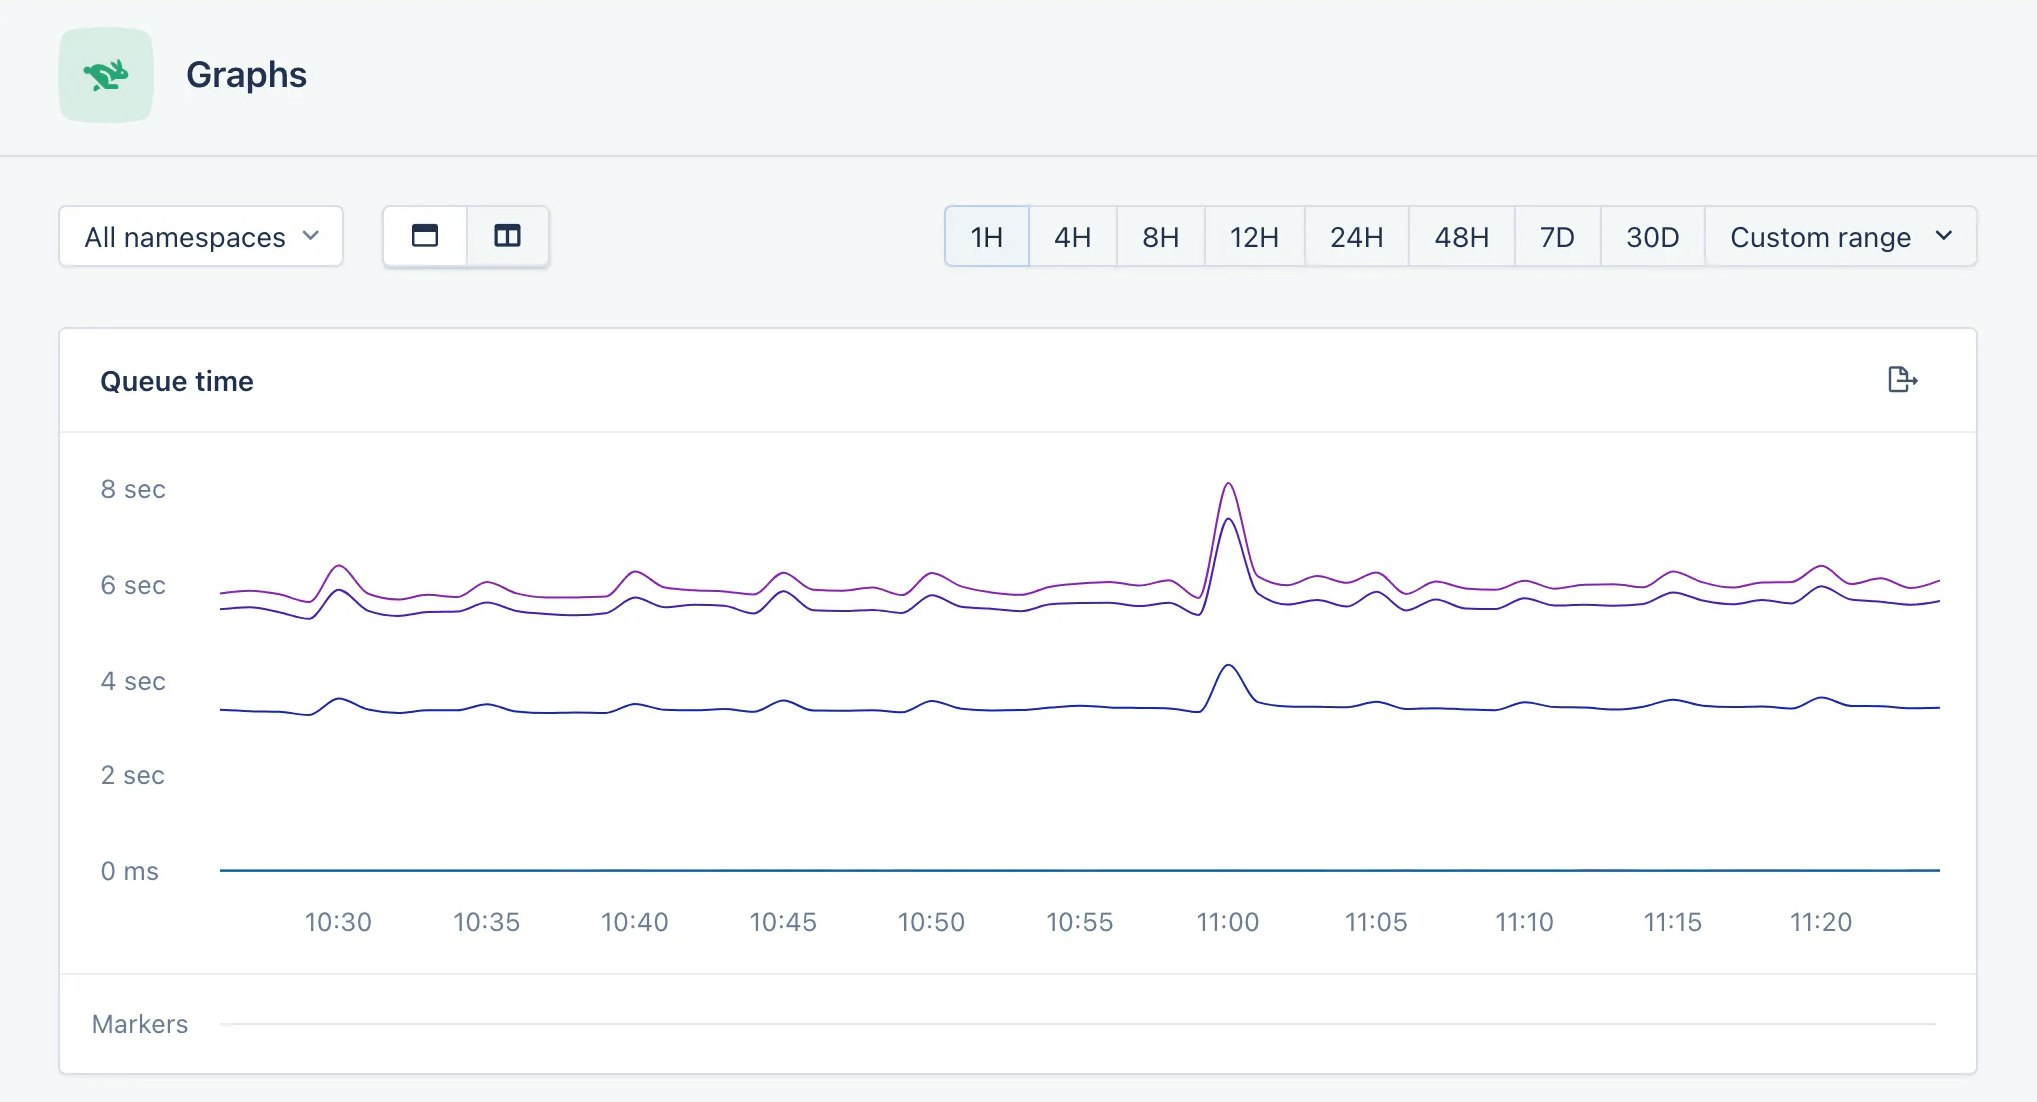
In normal operation, your application is always available to handle HTTP requests and the request queue time is close to 0.
But if you have requests reaching your application faster than it can respond to them, the Scalingo router will continue to distribute them randomly, until they start to queue up. For each application, this queue is capped at 50 requests per web container (the temporary parking area mentioned above). When all requests queues are full, the router returns 503 Service Unavailable and these requests are terminated without the application being aware. No one wants that.
That is the reason why it’s interesting to monitor the request queue time. Many factors can have a negative impact on this metric. The most common problem is not having enough application containers (check how to scale your application with Scalingo), but it may also have something to do with the payload size, or even a slow app code.
Works Best With an Application Performance Monitoring (APM)
You need a global view of your application to be able to draw relevant conclusions. This is why this feature is a great addition for a better APM integration! Our customers love using these tools to monitor their apps in real time, capturing detailed performance information, database queries, cache calls, external HTTP requests and so on. This makes it easier to identify and fix performance problems quickly.
Do you use AppSignal, Datadog, New Relic or Scout APM? You can already configure an alert to monitor the request queue time of your application.
Compatible With All Languages and Frameworks Supported by Scalingo
Not yet using an APM? We strongly advise you to use one for better insights into your application performance. But in the meantime you could update your application code to expose the X-Request-Start header. It’s accessible from all supported languages on Scalingo and has no impact on performance. You can use it to debug and monitor the performance of our application, or just ignore it for now. The data will be available to you when you need it!
Ready To Help You Focus On Your Code
This data is already available without any extra work! Read our documentation page about the X-Request-Start header and identify ways of improving the responsiveness of your application.
Try to scale your application, using an APM to identify slow requests and code improvements, deploy any changes in a review app to validate your assumptions and deliver a smoother experience to your customers! You will find everything you need to know in the Scalingo documentation.
Keep coding!